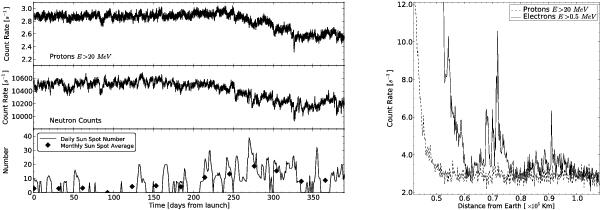
Fig.8

The top left panel shows the time evolution of an SREM measure (TC1, Buehler et al. 1996) which is sensitive to high-energy protons. The levels shortly after launch are also indicated (on the right), showing the passage through the van Allen radiation belts, characterised by very high count levels. The bottom panel (on the left) shows the corresponding evolution of the sunspot number, indicating the slow transition of the solar cycle out of its current minimum. A monitor of high-energy neutrons (in this case located at McMurdo station, data courtesy of Bartol Research Institute, supported by US NSF), presented in the middle panel, traces the corresponding decrease in the flux of Galactic cosmic rays as the Sun becomes more active.
Current usage metrics show cumulative count of Article Views (full-text article views including HTML views, PDF and ePub downloads, according to the available data) and Abstracts Views on Vision4Press platform.
Data correspond to usage on the plateform after 2015. The current usage metrics is available 48-96 hours after online publication and is updated daily on week days.
Initial download of the metrics may take a while.


