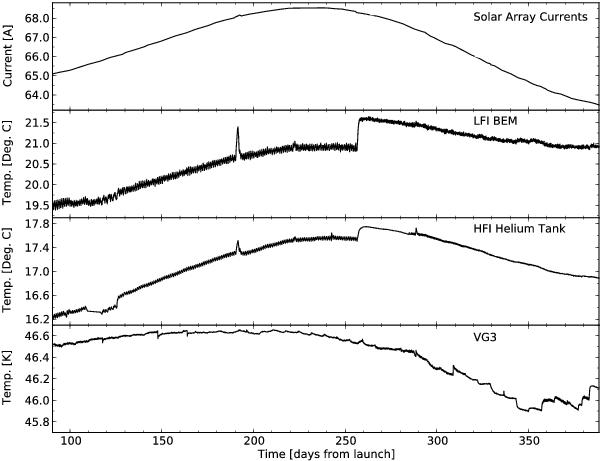
Fig.6

The main long-timescale thermal modulation is a seasonal effect driven by the solar power absorbed by the satellite. The evolution of the solar heat input is traced by the top figure which shows the total current produced by the solar panels; the long-term variation is largely a reflection of the distance from the Sun, with a very small modulation due to variations in the satellite’s aspect angle to the Sun. The top and second panels show the temperature variation at two representative locations in the room-temperature service module (SVM), i.e., on one of the (HFI) helium tanks and on one of the LFI back-end modules (BEM). The bottom panel shows the temperature evolution of VG3, the coldest of three stacked conical structures or V-grooves which radiatively isolate the warm SVM from the cold payload module. The seasonal effect is not dominant in the evolution of VG3, demonstrating the high thermal isolation of the payload from the SVM. Most variations on VG3 are due to weekly power input adjustments of the sorption cooler (see also Fig. 7), which is heat-sunk to VG3. The main operational disturbances during the routine phase which had a thermal impact can be seen in the middle two panels (see text for more detail): a) the “catbed” event between 110 and 126 days after launch; b) the “day Planck stood still” 191 days after launch; c) the change in temperature and its daily variation starting 257 days after launch, due to the RF transmitter being turned permanently on; and d) two star-tracker reconfiguration events, 242 and 288 days after launch.
Current usage metrics show cumulative count of Article Views (full-text article views including HTML views, PDF and ePub downloads, according to the available data) and Abstracts Views on Vision4Press platform.
Data correspond to usage on the plateform after 2015. The current usage metrics is available 48-96 hours after online publication and is updated daily on week days.
Initial download of the metrics may take a while.


