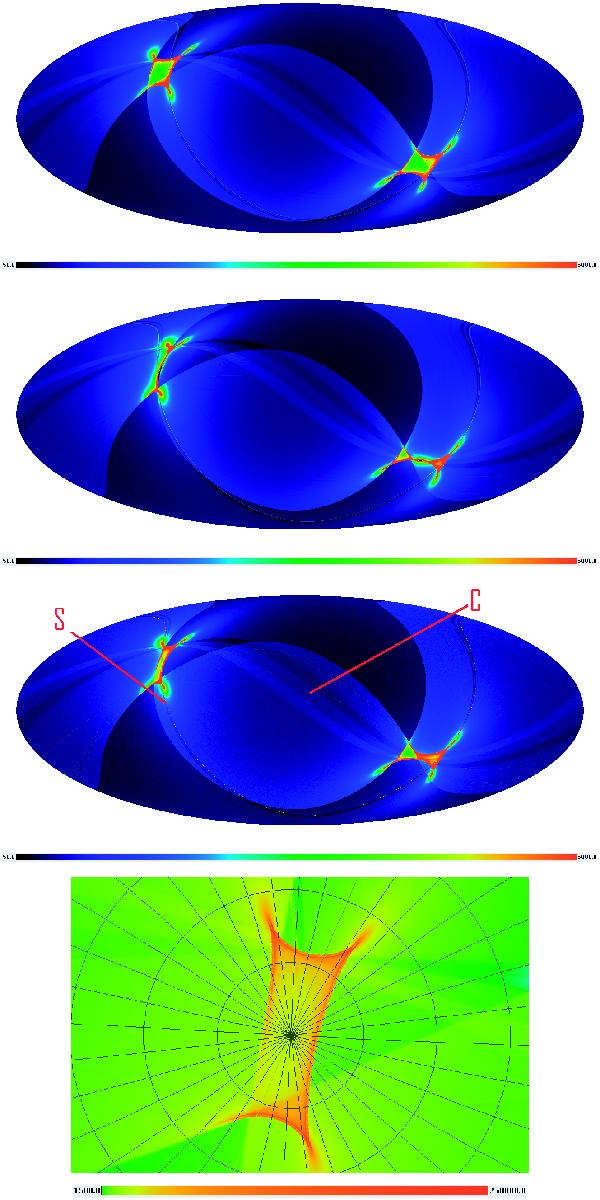
Fig.4

Survey coverage (the colour scale represents integration time varying between 50 and 5000 s deg-2) for three individual detectors located near the edges (LFI-24 and LFI-25 at 44 GHz, top panels) and centre of the focal plane HFI 353-1 at 353 GHz, third panel). The maps are Mollweide projections of the whole sky in Galactic coordinates, pixelised according to the Healpix (Górski et al. 2005) scheme at Nside = 1024. The features due to “the day Planck stood still” and the Crab slow-down (Sect. 4.2) are pointed out as “S” and “C” respectively. The bottom panel is a zoom on the area around the North Ecliptic Pole, showing (in logarithmic scale) the distribution of high sensitivity observations integrated for all 100 GHz detectors.
Current usage metrics show cumulative count of Article Views (full-text article views including HTML views, PDF and ePub downloads, according to the available data) and Abstracts Views on Vision4Press platform.
Data correspond to usage on the plateform after 2015. The current usage metrics is available 48-96 hours after online publication and is updated daily on week days.
Initial download of the metrics may take a while.


