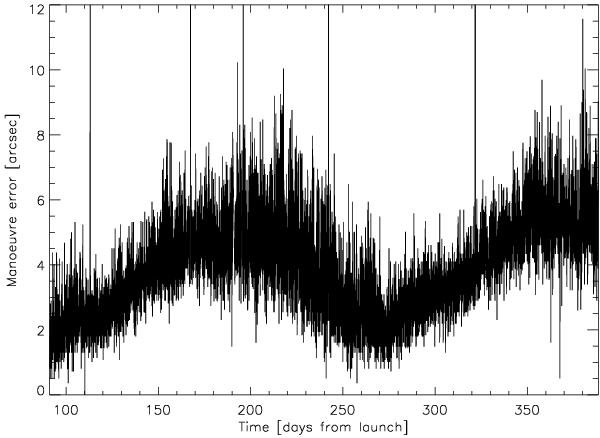
Fig.12

The plot shows the difference between the achieved and commanded pointing after each 2′ manoeuvre; the difference is correlated with the duration of the previous dwell (see text). The vertical lines correspond to the very few occasions when the manoeuvre sequence did not execute as planned, resulting in anomalously high pointing errors.
Current usage metrics show cumulative count of Article Views (full-text article views including HTML views, PDF and ePub downloads, according to the available data) and Abstracts Views on Vision4Press platform.
Data correspond to usage on the plateform after 2015. The current usage metrics is available 48-96 hours after online publication and is updated daily on week days.
Initial download of the metrics may take a while.


