Fig.6
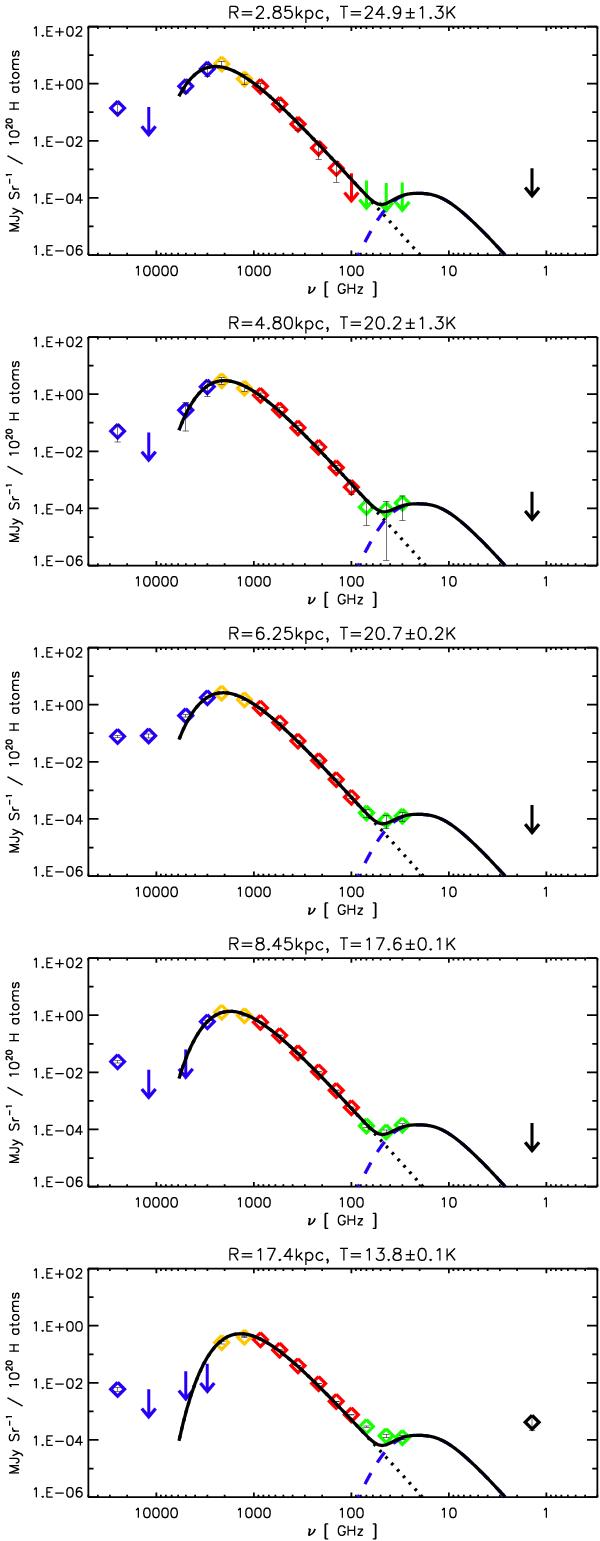
SEDs for the atomic component, each sorted in increasing Galactocentric radius. The colour of the symbols refer to the mission the data came from: IRAS (blue), DIRBE (yellow), HFI (red), LFI (green) and 1.4 GHz (black). The SEDs also show various fitted laws: the dotted line is the thermal dust SED, the short dashed line spinning dust in an atomic medium, and the solid line the sum of all contributions. The spinning dust contribution is not a fit, but simply the result of using typical values in the model (see Sect. 4.2.3 for details). The contribution of the atomic component in the outer Galaxy to the 1.4 GHz signal is lower than the noise level derived for the 1.4 GHz map and so should not be viewed as significant.
Current usage metrics show cumulative count of Article Views (full-text article views including HTML views, PDF and ePub downloads, according to the available data) and Abstracts Views on Vision4Press platform.
Data correspond to usage on the plateform after 2015. The current usage metrics is available 48-96 hours after online publication and is updated daily on week days.
Initial download of the metrics may take a while.