Fig.3
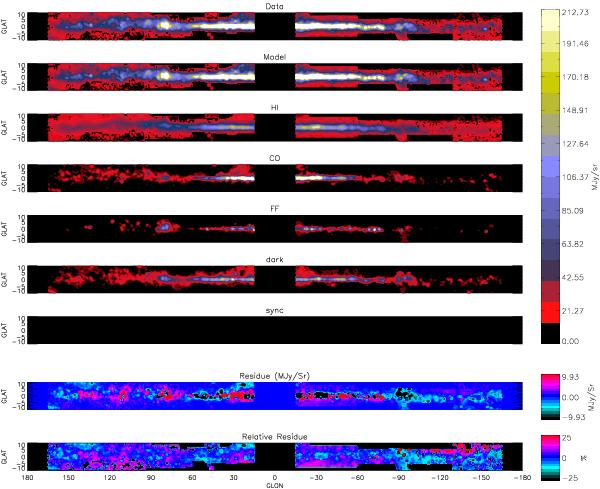
Results of the inversion for the 857 GHz band. From top to bottom are: observed emission; modelled emission; atomic contribution; molecular contribution; ionised contribution; dark gas contribution; synchrotron contribution; residual; and relative residual. All images except for the residual maps are at the same intensity scale. The centre and anti-centre regions have been masked, as the kinematic distance method is inapplicable to these regions. Areas where no CO observations are available have also been masked.
Current usage metrics show cumulative count of Article Views (full-text article views including HTML views, PDF and ePub downloads, according to the available data) and Abstracts Views on Vision4Press platform.
Data correspond to usage on the plateform after 2015. The current usage metrics is available 48-96 hours after online publication and is updated daily on week days.
Initial download of the metrics may take a while.