Free Access
Fig.14
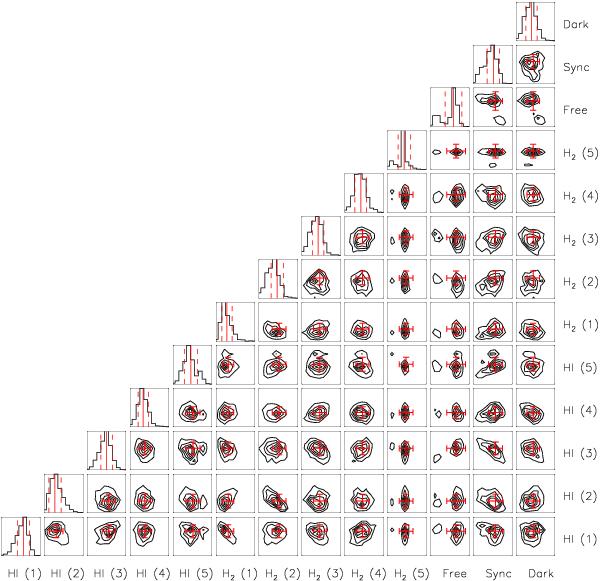
Correlation matrix of the emissivities for each ring at 30 GHz. Overplotted in red are the results with corresponding error bars. One-dimensional histograms replace the contour plots where only one component is concerned.
Current usage metrics show cumulative count of Article Views (full-text article views including HTML views, PDF and ePub downloads, according to the available data) and Abstracts Views on Vision4Press platform.
Data correspond to usage on the plateform after 2015. The current usage metrics is available 48-96 hours after online publication and is updated daily on week days.
Initial download of the metrics may take a while.