Free Access
Fig. 15
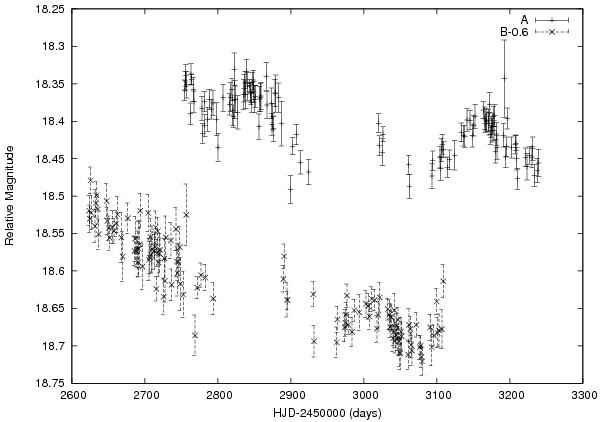
Light curves for SBS 1520+530 based on Gaynullina et al. (2005a)’s data after shifting the B curve by ΔtAB = 130.5 days. Hardly any data points overlap between the light curves for images A and B.
Current usage metrics show cumulative count of Article Views (full-text article views including HTML views, PDF and ePub downloads, according to the available data) and Abstracts Views on Vision4Press platform.
Data correspond to usage on the plateform after 2015. The current usage metrics is available 48-96 hours after online publication and is updated daily on week days.
Initial download of the metrics may take a while.