Free Access
Fig. 1
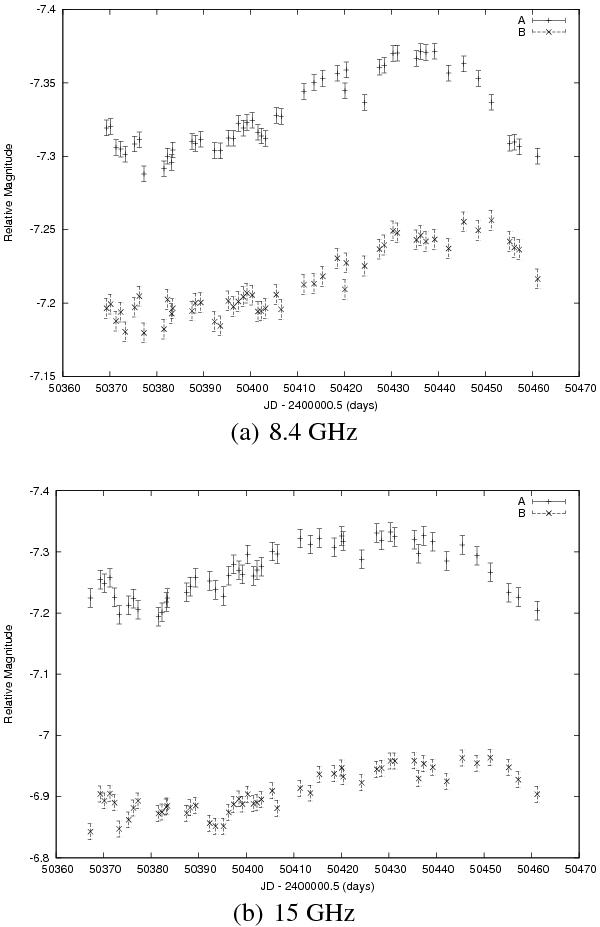
Light curves at 8.4 GHz and 15 GHz for JVAS B0218+357 after transforming the flux density measurements into magnitudes. The B curve has been shifted by 1 magnitude for clarity.
This figure is made of several images, please see below:
Current usage metrics show cumulative count of Article Views (full-text article views including HTML views, PDF and ePub downloads, according to the available data) and Abstracts Views on Vision4Press platform.
Data correspond to usage on the plateform after 2015. The current usage metrics is available 48-96 hours after online publication and is updated daily on week days.
Initial download of the metrics may take a while.