Fig. 5
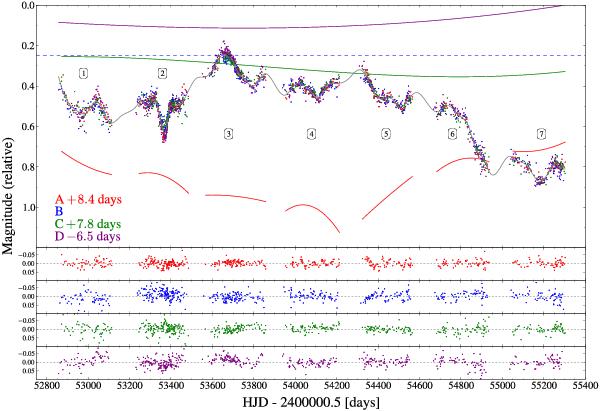
Light curves obtained with all four telescopes and shifted by time delays of ΔtBA = 8.4 days, ΔtBC = 7.8 days and ΔtBD = −6.5 days. The relative microlensing representations applied on curves A, C and D are shown as continuous curves with respect to the dashed blue line (see text). A fifth-order polynomial was used over the seven seasons to model microlensing on the quasar images C and D, while seven independent third-order polynomials were used for image A. The lower panels show residuals obtained by subtracting a simultaneous spline fit (grey) from the light curves.
Current usage metrics show cumulative count of Article Views (full-text article views including HTML views, PDF and ePub downloads, according to the available data) and Abstracts Views on Vision4Press platform.
Data correspond to usage on the plateform after 2015. The current usage metrics is available 48-96 hours after online publication and is updated daily on week days.
Initial download of the metrics may take a while.