Free Access
Fig. 1
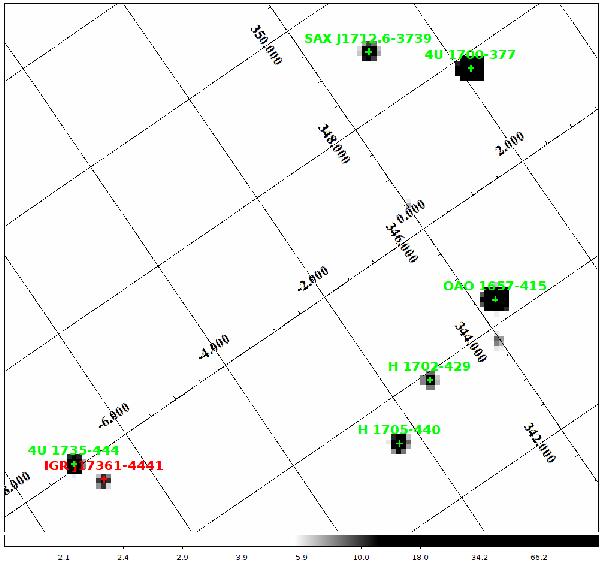
IBIS/ISGRI FOV around IGR J17361-4441 (20–100 keV energy band). We used data from rev. 1078 to 1083. The horizontal band on the bottom of the image shows the colour-coded significances in the mosaic expressed in units of σ.
Current usage metrics show cumulative count of Article Views (full-text article views including HTML views, PDF and ePub downloads, according to the available data) and Abstracts Views on Vision4Press platform.
Data correspond to usage on the plateform after 2015. The current usage metrics is available 48-96 hours after online publication and is updated daily on week days.
Initial download of the metrics may take a while.