Fig. 6
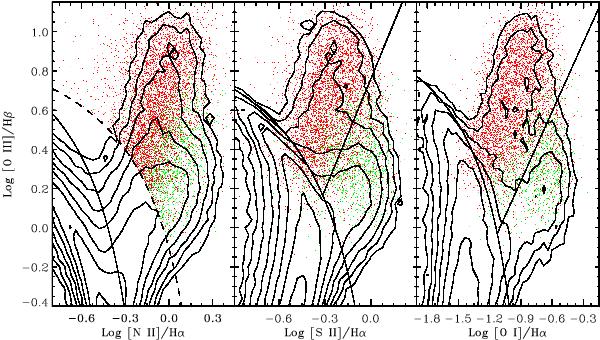
Spectroscopic diagnostic diagrams for all DR7 emission line galaxies with z < 0.1. Contours represent their iso-densities and are drawn with a common ratio of 2. Dots show the location of the outliers (i.e., objects with a line excess with respect to the median value by a factor of R [O III] > 5 (red) or 3 (green) in Fig. 1) limiting to those falling in the AGN in the left diagram, i.e., excluding star-forming and composite galaxies.
Current usage metrics show cumulative count of Article Views (full-text article views including HTML views, PDF and ePub downloads, according to the available data) and Abstracts Views on Vision4Press platform.
Data correspond to usage on the plateform after 2015. The current usage metrics is available 48-96 hours after online publication and is updated daily on week days.
Initial download of the metrics may take a while.