Free Access
Fig. 2
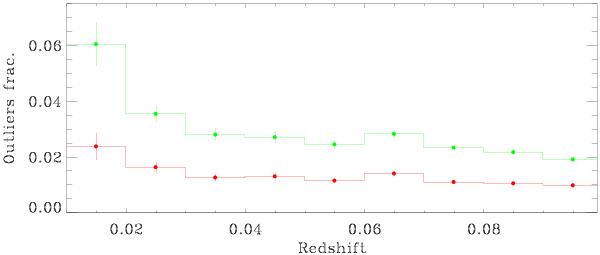
Fraction of outliers versus redshift for the red galaxies, dominated by an old stellar population, i.e., with Dn(4000) > 1.7. Green dots and histogram are weak outliers, the red ones are strong outliers.
Current usage metrics show cumulative count of Article Views (full-text article views including HTML views, PDF and ePub downloads, according to the available data) and Abstracts Views on Vision4Press platform.
Data correspond to usage on the plateform after 2015. The current usage metrics is available 48-96 hours after online publication and is updated daily on week days.
Initial download of the metrics may take a while.