Fig. 10
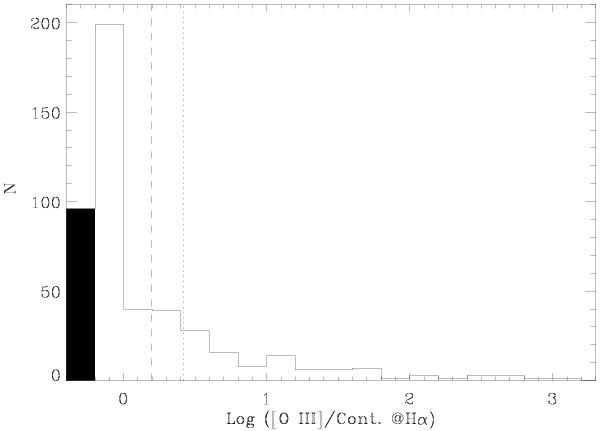
Logarithm of the ratio between the [O III] flux and the continuum around the Hα line for the Palomar sample. The vertical lines are located at 3 and 5 times the median value measured for the SDSS red galaxies, i.e., 0.52 Å. The first bin of the distribution contains the 28 emission line galaxies where the [O III] line is not detected and the 68 lineless galaxies.
Current usage metrics show cumulative count of Article Views (full-text article views including HTML views, PDF and ePub downloads, according to the available data) and Abstracts Views on Vision4Press platform.
Data correspond to usage on the plateform after 2015. The current usage metrics is available 48-96 hours after online publication and is updated daily on week days.
Initial download of the metrics may take a while.