Fig. 8
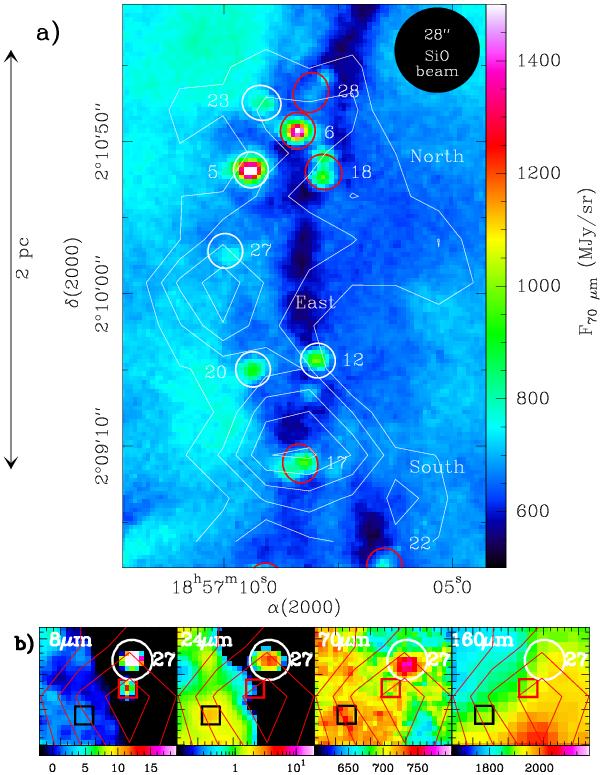
a) Part of G035.39–00.33 seen at 70 μm (colour) and in SiO (contours from 0.01 to 0.05 K kms-1 by 0.01 K kms-1 from Jiménez-Serra et al. 2010). The dense cores with mass > 20 M⊙ are indicated by red ellipses, those with mass < 20 M⊙ by white ellipses. b) Zoom towards source #27 seen at 8–160 μm. Red and black boxes indicate the 8 μm–only and 24 μm–only sources, respectively.
Current usage metrics show cumulative count of Article Views (full-text article views including HTML views, PDF and ePub downloads, according to the available data) and Abstracts Views on Vision4Press platform.
Data correspond to usage on the plateform after 2015. The current usage metrics is available 48-96 hours after online publication and is updated daily on week days.
Initial download of the metrics may take a while.