Fig. 4
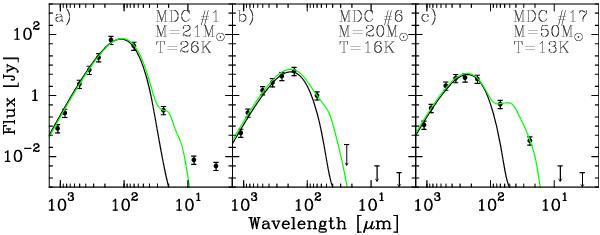
SEDs built from Herschel and other wavelengths of: the UCH II region a) and two MDCs associated with SiO emission b) and c). The curves are grey-body models fitted to data at wavelengths ≥ 160 μm. The single temperature grey-body fit (black curve) is consistent with the two temperatures grey-body fit (green curve). Error bars correspond to 30% of the integrated fluxes.
Current usage metrics show cumulative count of Article Views (full-text article views including HTML views, PDF and ePub downloads, according to the available data) and Abstracts Views on Vision4Press platform.
Data correspond to usage on the plateform after 2015. The current usage metrics is available 48-96 hours after online publication and is updated daily on week days.
Initial download of the metrics may take a while.