Fig. 2
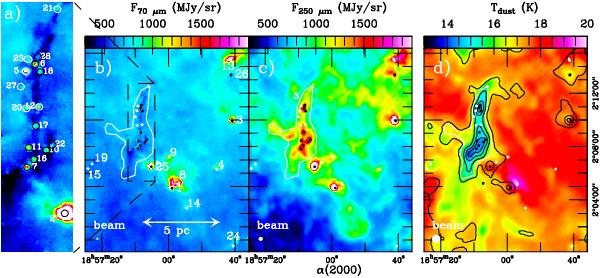
a) PACS 70 μm image of the G035.39–00.33 filament; b) PACS 70 μm image of the G035.39–00.33 filament and its surroundings; c) SPIRE 250 μm image of the G035.39–00.33 filament and its surroundings; d) temperature (colour) and column density (contours from 1.5 to 9 by 1.5 × 1022 cm-2) images. The dense cores with mass >20 M⊙ are indicated by black ellipses, those with mass <20 M⊙ by white ellipses. The elliptical sizes represent the FWHM sizes at 160 μm. The extent of the IRDC (>3 × 1022 cm-2) is indicated by a white polygon in b–d.
Current usage metrics show cumulative count of Article Views (full-text article views including HTML views, PDF and ePub downloads, according to the available data) and Abstracts Views on Vision4Press platform.
Data correspond to usage on the plateform after 2015. The current usage metrics is available 48-96 hours after online publication and is updated daily on week days.
Initial download of the metrics may take a while.