Fig. 6
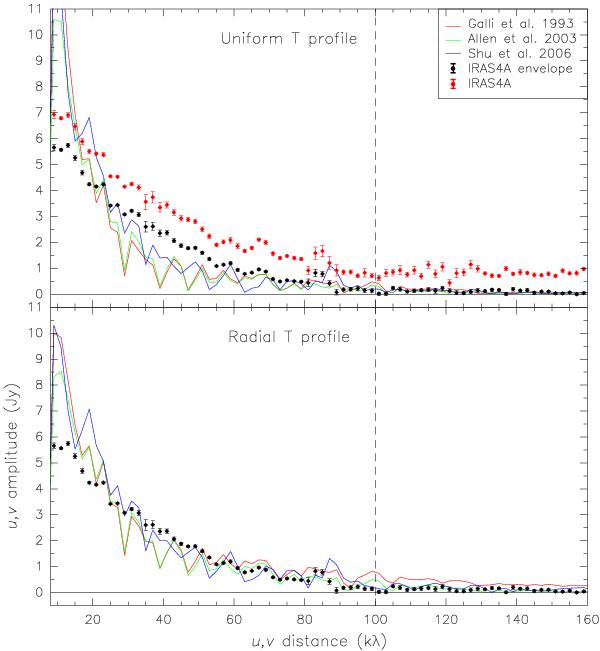
Stokes I visibility amplitudes vs. u,v distance averaged in bins of 2kλ. Top panel: uniform temperature profile. Bottom panel: radial temperature profile. Red and black dots: IRAS 4A full data and envelope data, respectively, with their statistical error bars. Vertical dashed line: u,v distance threshold used to derive the compact components map (see Fig. 1). Starting at ~90 kλ the emission seems to match with an unresolved source of ~1 Jy. Red, green, and blue solid curves: visibility amplitudes derived after convolving the Galli & Shu (1993a,b), Allen et al. (2003a,b), and Shu et al. (2006) models, respectively, used to generate the maps of left-hand panels of Figs. 7 and 8.
Current usage metrics show cumulative count of Article Views (full-text article views including HTML views, PDF and ePub downloads, according to the available data) and Abstracts Views on Vision4Press platform.
Data correspond to usage on the plateform after 2015. The current usage metrics is available 48-96 hours after online publication and is updated daily on week days.
Initial download of the metrics may take a while.