Free Access
Fig. 5
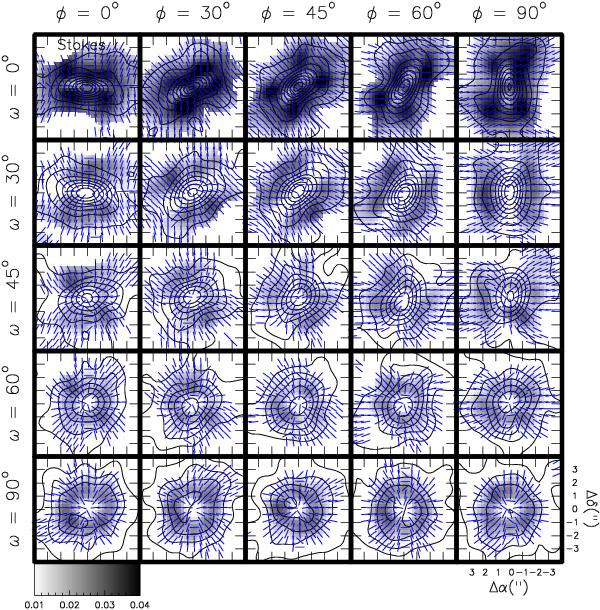
Same as Fig. 4 but for Stokes I maps. Each panel show the total emission (contours), the polarized emission (pixel map) and the magnetic field direction (segments). Map contours: for Stokes I represent steps of 6-σ starting at 6-σ, where σ = 0.02 Jy beam-1.
Current usage metrics show cumulative count of Article Views (full-text article views including HTML views, PDF and ePub downloads, according to the available data) and Abstracts Views on Vision4Press platform.
Data correspond to usage on the plateform after 2015. The current usage metrics is available 48-96 hours after online publication and is updated daily on week days.
Initial download of the metrics may take a while.