Fig. 4
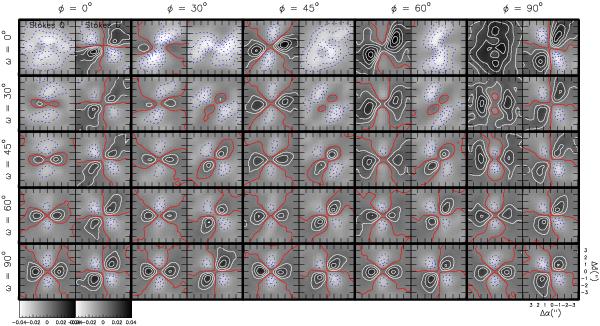
Dependence of the synthetic Stokes Q and U maps on the orientation angles. The maps shown corresponds to the Allen et al. (2003a,b) model with H0 = 0.125, v0 = 0 and t = 2 × 10⁴ yr. Thick contours: correspond to a single combination of position and inclination angle. Individual panels: inside thick contours two panels are shown. Stokes Q and U map are shown in the left- and right-hand side panels, respectively. Common color scale for each Stokes map is shown below the first column. The angular scale is shown in the bottom right-hand side panel. Map contours: represent steps of 3-σ starting at 3-σ, where σ = 2.5 mJy beam-1. Columns: correspond to a position angle, φ, shown on the top. Rows: correspond to an inclination angle, ω, shown on the left-hand side of the figure.
Current usage metrics show cumulative count of Article Views (full-text article views including HTML views, PDF and ePub downloads, according to the available data) and Abstracts Views on Vision4Press platform.
Data correspond to usage on the plateform after 2015. The current usage metrics is available 48-96 hours after online publication and is updated daily on week days.
Initial download of the metrics may take a while.