Fig. 11
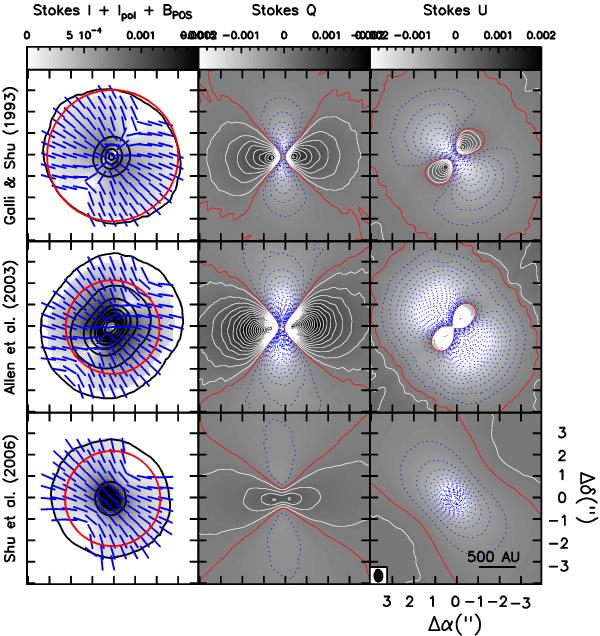
Same as Fig. 8 for ALMA configuration 09. Contours: contours for the Stokes I maps (left panels) depict emission levels from 5σ up to the maximum value in steps of 50σ, where σ = 0.2 mJy beam-1. Positive contours for the Stokes Q and U maps depict levels from 5σ up to the maximum in steps of 10σ, where σ = 0.02 mJy beam-1. Negative contours follow the same rule. Red circles: for the Galli & Shu (1993a,b) and Allen et al. (2003a,b) models depict the loci of the front of the isothermal collapse wave (r = cst, see Fig. 2 of Galli & Shu 1993a and Fig. 6 of Allen et al. 2003a). For the Shu et al. (2006) model it marks the 10 rOhm distance (see Fig. 4 of Shu et al. 2006).
Current usage metrics show cumulative count of Article Views (full-text article views including HTML views, PDF and ePub downloads, according to the available data) and Abstracts Views on Vision4Press platform.
Data correspond to usage on the plateform after 2015. The current usage metrics is available 48-96 hours after online publication and is updated daily on week days.
Initial download of the metrics may take a while.