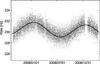
Fig. 7
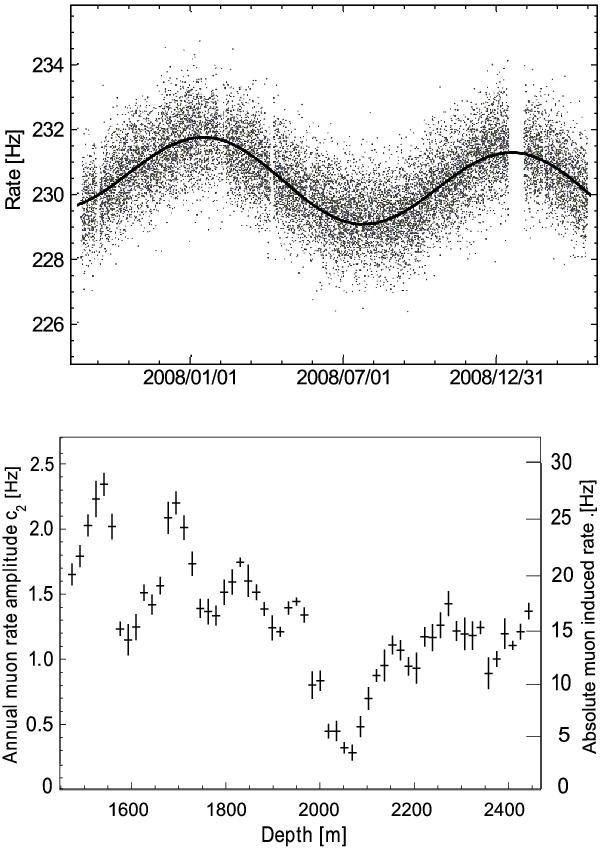
Top: rate of a typical DOM as function of time covering 556 days of lifetime as measured in 0.5 s bins (baseline suppressed). The line corresponds to a rate fit according to Eq. (12). Bottom: parameter c2 and estimated muon induced rate as function of depth. The variation with depth is mostly due to the optical properties of the ice and muons ranging out.
Current usage metrics show cumulative count of Article Views (full-text article views including HTML views, PDF and ePub downloads, according to the available data) and Abstracts Views on Vision4Press platform.
Data correspond to usage on the plateform after 2015. The current usage metrics is available 48-96 hours after online publication and is updated daily on week days.
Initial download of the metrics may take a while.