Fig. 4
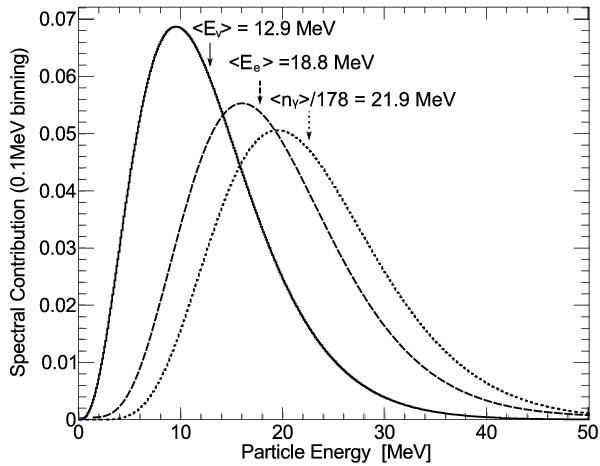
Example for an anti-electron neutrino energy spectrum with α = 2.92 predicted for an 8.8 solar mass O-Ne-Mg core supernovae collapse (Hüdepohl et al. 2010) one second after the onset of the burst (solid line). Also shown is the cross section weighted energy spectrum of produced positrons and electrons from inverse beta decay (dashed line) as well as a measure of the detectable energy, which is proportional to the number of Cherenkov photons Nγ in the (300–600) nm range (dotted line). The relation Nγ = a·Ee with a = 178 MeV-1 is used.
Current usage metrics show cumulative count of Article Views (full-text article views including HTML views, PDF and ePub downloads, according to the available data) and Abstracts Views on Vision4Press platform.
Data correspond to usage on the plateform after 2015. The current usage metrics is available 48-96 hours after online publication and is updated daily on week days.
Initial download of the metrics may take a while.