Fig. 3
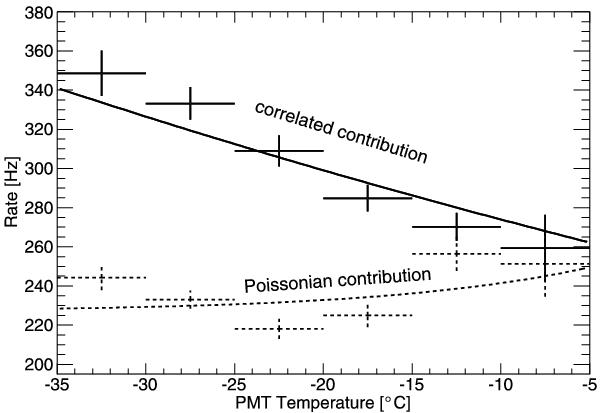
Measured average noise rates of 120 DOMs as function of DOM temperature. The excess of short time intervals due to bursts (solid) is fitted to the empirical model of Meyer (2010). The Poissonian contribution (dashed) has not been corrected for the depth (and thus temperature) dependent contribution of atmospheric muons (see Fig. 7). The dotted line is a comparison to the predicted thermal noise from Richardson’s law plus a constant rate of C = 225 ± 6 Hz.
Current usage metrics show cumulative count of Article Views (full-text article views including HTML views, PDF and ePub downloads, according to the available data) and Abstracts Views on Vision4Press platform.
Data correspond to usage on the plateform after 2015. The current usage metrics is available 48-96 hours after online publication and is updated daily on week days.
Initial download of the metrics may take a while.