Fig. 2
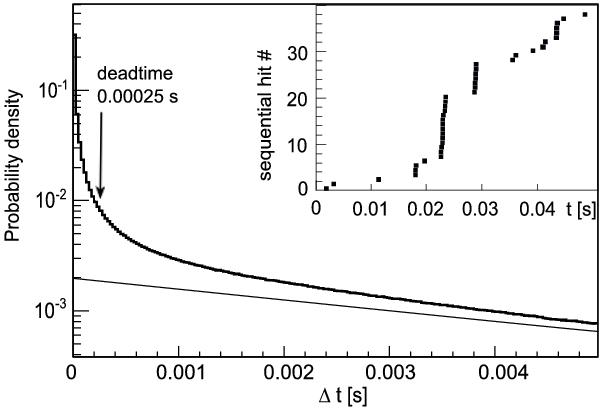
Probability density distribution of time differences between pulses for noise (bold line) and the exponential expectation for a Poissonian process fitted in the range 15 ms < ΔT < 50 ms (thin line). The excess is due to bursts of correlated hits, as can be seen from the 50 ms long snapshot of hit times shown in the insert.
Current usage metrics show cumulative count of Article Views (full-text article views including HTML views, PDF and ePub downloads, according to the available data) and Abstracts Views on Vision4Press platform.
Data correspond to usage on the plateform after 2015. The current usage metrics is available 48-96 hours after online publication and is updated daily on week days.
Initial download of the metrics may take a while.