Fig. 12
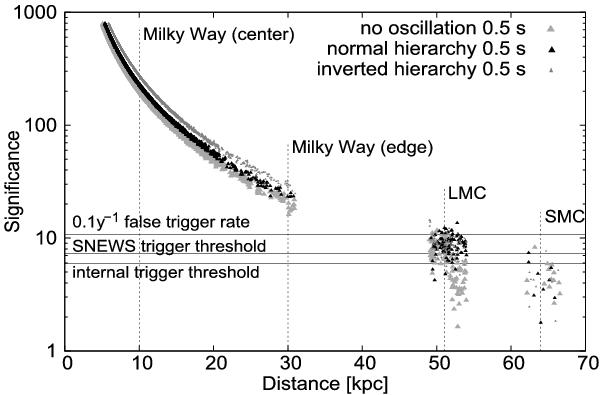
Significance versus distance assuming the Lawrence-Livermore model. The significances are increased by neutrino oscillations in the star by typically 15% in case of a normal hierarchy (Scenario A) and 40% in case of an inverted hierarchy (Scenario B). The Magellanic Clouds as well as center and edge of the Milky Way are marked. The density of the data points reflect the star distribution.
Current usage metrics show cumulative count of Article Views (full-text article views including HTML views, PDF and ePub downloads, according to the available data) and Abstracts Views on Vision4Press platform.
Data correspond to usage on the plateform after 2015. The current usage metrics is available 48-96 hours after online publication and is updated daily on week days.
Initial download of the metrics may take a while.