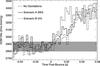
Fig. 11
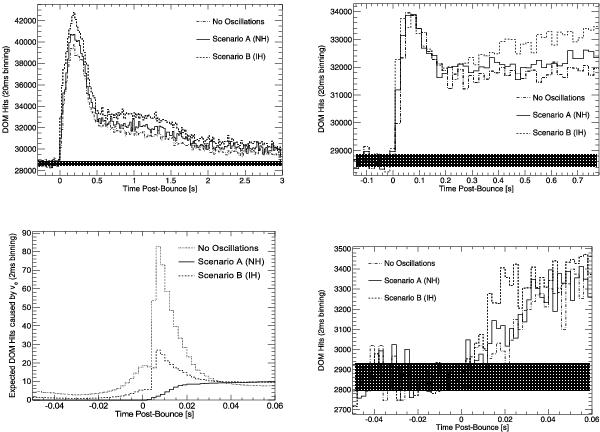
Top: expected rate distribution at 10 kpc supernova distance for oscillation scenarios A (normal hierarchy) and B (inverted hierarchy). Fluxes and energies in the left plot are taken from the Lawrence-Livermore model and in the right plot from the Garching model using the equation of state of Lattimer & Swesty (1991). Scenario C (not shown) is almost indistinguishable from Scenario A. The case of no oscillation is given as a reference. Bottom: expected average signal rate distribution at 10 kpc distance in finest 2 ms binning for Scenarios A and B using the Garching model; the unlikely case of no oscillation is given as a reference. The left plot shows the expected νe induced signal. As can be seen from the right plot, the signal is no longer apparent, once the large contribution due to the inverse beta decay and the expected DOM noise are added. The 1σ-bands corresponding to measured detector noise (hatched area) have a width of about ± 215 counts for a 20 ms binning and ± 70 counts for a 2 ms binning.
Current usage metrics show cumulative count of Article Views (full-text article views including HTML views, PDF and ePub downloads, according to the available data) and Abstracts Views on Vision4Press platform.
Data correspond to usage on the plateform after 2015. The current usage metrics is available 48-96 hours after online publication and is updated daily on week days.
Initial download of the metrics may take a while.