Fig. 17
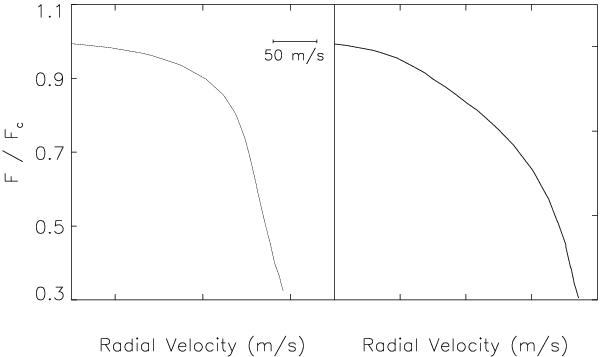
Left: the bisector of the CCF obtained by the cross-correlation of the solar synthetic spectrum and “G” mask for the 6215–6275 Å region. Right: the bisector of the CCF obtained by the cross-correlation of a solar observed spectrum and “G” mask for the same region. Scale for x-axis is given on the figures and valid for both panels.
Current usage metrics show cumulative count of Article Views (full-text article views including HTML views, PDF and ePub downloads, according to the available data) and Abstracts Views on Vision4Press platform.
Data correspond to usage on the plateform after 2015. The current usage metrics is available 48-96 hours after online publication and is updated daily on week days.
Initial download of the metrics may take a while.