Fig. 6
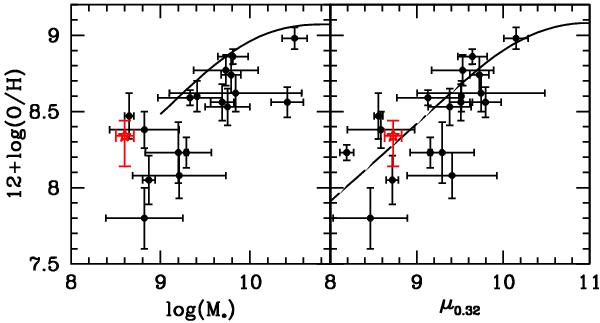
Left panel: M-Z realtion. The black points with error bars correspond to the GRB M⋆ and metallicities used in Mannucci et al. (2011), whereas the black line shows the fit to the local M-Z relation presented in the same paper. Right panel: FMR relation. The black points with error bars correspond to the GRB μ0.32 ≡ log (M⋆) − 0.32 log (SFR) and metallicities used in Mannucci et al. (2011), whereas the black line shows the extended FMR relation presented in the same paper. In both panels, the values for GRB 091127 are represented by a red star with error bars. A colour version of this figure is available online.
Current usage metrics show cumulative count of Article Views (full-text article views including HTML views, PDF and ePub downloads, according to the available data) and Abstracts Views on Vision4Press platform.
Data correspond to usage on the plateform after 2015. The current usage metrics is available 48-96 hours after online publication and is updated daily on week days.
Initial download of the metrics may take a while.