Fig. 4
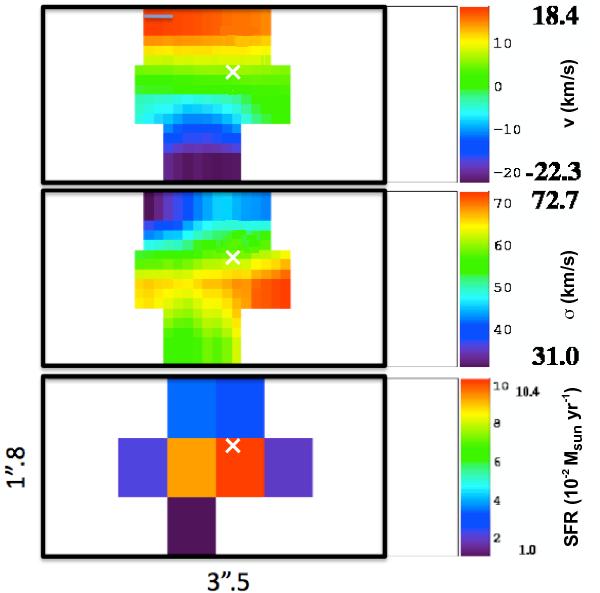
From top to bottom: IFU velocity, velocity dispersion, and SFR (Salpeter IMF) maps (1″ = 6.018 kpc). Each map is orientated following the direction of the arrow reported in Fig. 3 (bottom to top). The afterglow position is indicated by the white cross. The velocity and velocity dispersion maps are interpolated to spaxels of  for clearer viewing. A colour version of this figure is available online.
Current usage metrics show cumulative count of Article Views (full-text article views including HTML views, PDF and ePub downloads, according to the available data) and Abstracts Views on Vision4Press platform.
Data correspond to usage on the plateform after 2015. The current usage metrics is available 48-96 hours after online publication and is updated daily on week days.
Initial download of the metrics may take a while.