Fig. 1
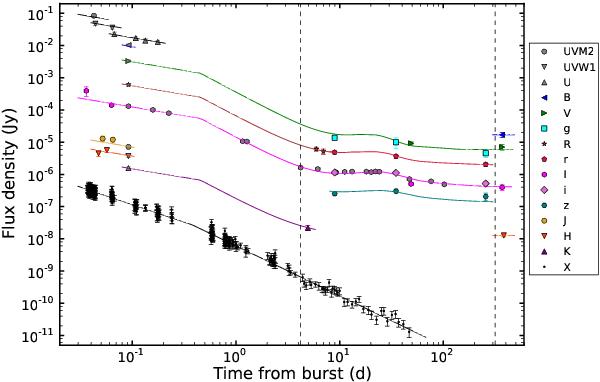
Optical and X-ray light-curves of the GRB 091127 afterglow. The symbol legend is to the right of the plot. Fluxes have been rescaled for clarity, except for the R- and r-filters (UVM2 × 200, UVW1 × 100, U × 50, B × 20, V × 6, g × 6, I × 0.2, i × 0.2, z × 0.05, J × 0.01, H × 0.005, K × 0.002, and X × 0.01). Coloured symbols correspond to our data set, whereas grey symbols refers to the data published in the literature (see Cobb et al. 2010 and references therein). The solid curves show the best-fit relation for each band. A colour version of this figure is available online.
Current usage metrics show cumulative count of Article Views (full-text article views including HTML views, PDF and ePub downloads, according to the available data) and Abstracts Views on Vision4Press platform.
Data correspond to usage on the plateform after 2015. The current usage metrics is available 48-96 hours after online publication and is updated daily on week days.
Initial download of the metrics may take a while.