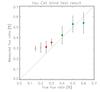
Fig. 5
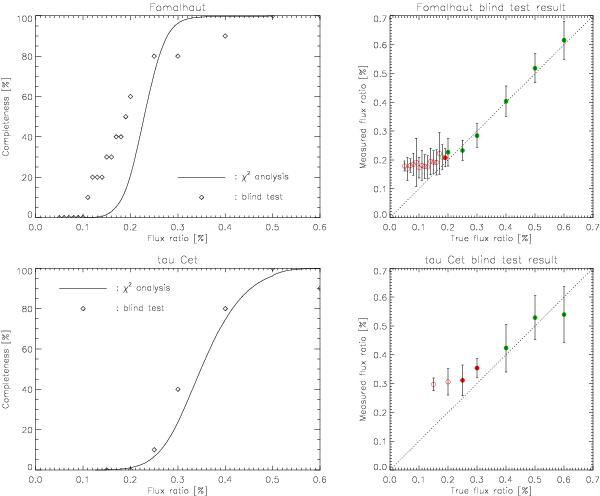
Blind test result for Fomalhaut (top) and tau Cet (bottom). Left. Cumulated histogram of the 3σ detection limit for companions located within the 100 mas search region, based on the χ2 analysis. Over-plotted in diamonds are the results of the double-blind tests discussed in Sect. 5.1. Right. Measured vs. true flux ratio for the blind tests. Filled points are used when 50% or more of the companions have been found at the good position and with the good flux ratio (empty points otherwise). Green points are used when the mean significance of the best fit is larger than 3σ (red points otherwise). The error bars represent the dispersion of the best-fit flux ratios.
Current usage metrics show cumulative count of Article Views (full-text article views including HTML views, PDF and ePub downloads, according to the available data) and Abstracts Views on Vision4Press platform.
Data correspond to usage on the plateform after 2015. The current usage metrics is available 48-96 hours after online publication and is updated daily on week days.
Initial download of the metrics may take a while.