Fig. 4
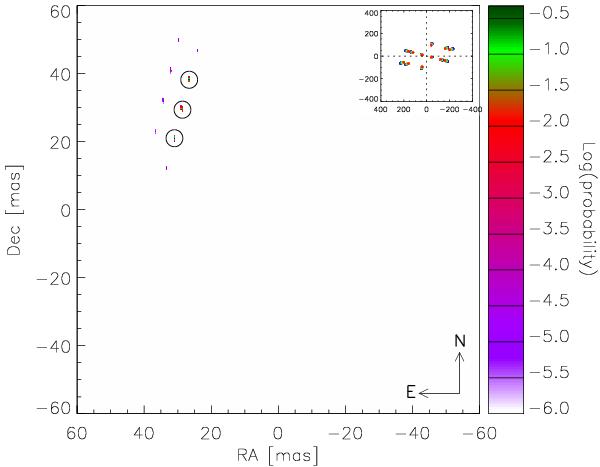
Probability (Eq. (2)) for the best-fit binary models to reproduce the data set on a 60 × 60 mas search region around del Aqr. The highest three maxima are identified by circles. The u,v coverage associated to this data set is represented in the upper right inset, including wavelength dependence (using colours from blue to red), with the axes graduated in cycles per arcsec.
Current usage metrics show cumulative count of Article Views (full-text article views including HTML views, PDF and ePub downloads, according to the available data) and Abstracts Views on Vision4Press platform.
Data correspond to usage on the plateform after 2015. The current usage metrics is available 48-96 hours after online publication and is updated daily on week days.
Initial download of the metrics may take a while.