Free Access
Fig. 3
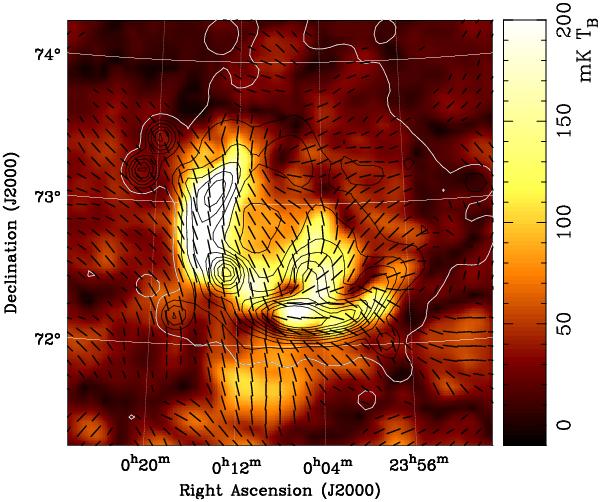
Same as Fig. 1 (lower panel) but for the EMLS λ21 cm map. Total intensity contour levels start at 200 mK TB and run in steps of 200 mK TB.
Current usage metrics show cumulative count of Article Views (full-text article views including HTML views, PDF and ePub downloads, according to the available data) and Abstracts Views on Vision4Press platform.
Data correspond to usage on the plateform after 2015. The current usage metrics is available 48-96 hours after online publication and is updated daily on week days.
Initial download of the metrics may take a while.