Fig. 1
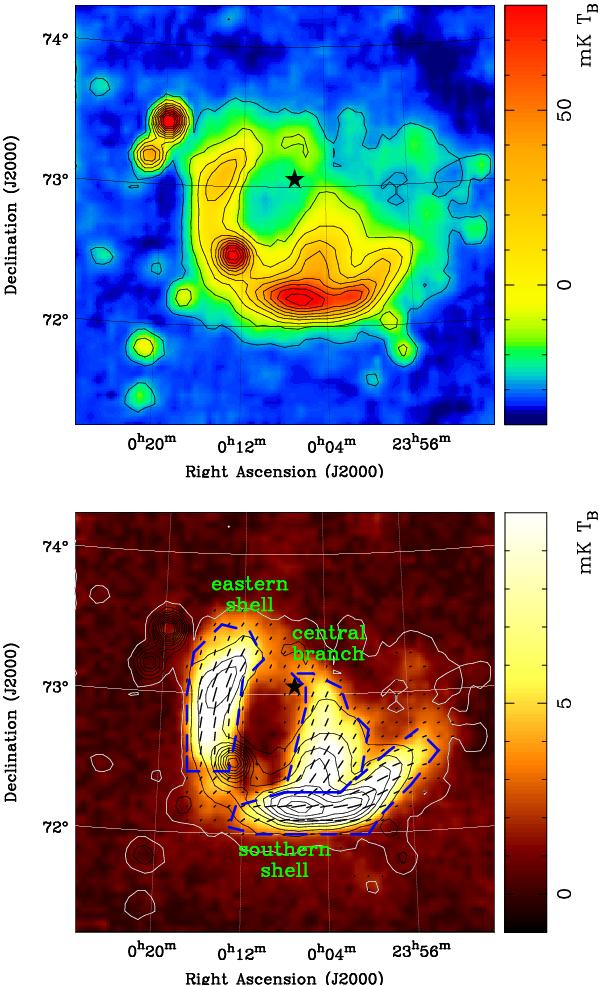
Urumqi λ6 cm maps. Total intensities are displayed as image and contours in the upper panel. Polarisation intensities are displayed as an image in the lower panel, overlaid with bars showing B-vectors (i.e. observed E-vectors rotated by 90) and total intensity contours. The lengths of the bars are proportional to polarisation intensities with a cutoff below 5 × σPI. Contours start at 5 mK TB and run in steps of 10 mK TB. The gamma-ray pulsar discovered by Fermi (Abdo et al. 2008) is marked as a star. The eastern shell, central branch, and southern shell are sketched by blue dashed lines.
Current usage metrics show cumulative count of Article Views (full-text article views including HTML views, PDF and ePub downloads, according to the available data) and Abstracts Views on Vision4Press platform.
Data correspond to usage on the plateform after 2015. The current usage metrics is available 48-96 hours after online publication and is updated daily on week days.
Initial download of the metrics may take a while.