Free Access
Fig. 5
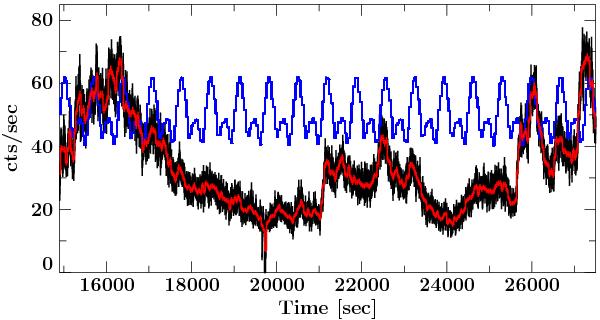
Small part of the light curve between 0.3 − 12.0 keV, showing a vanishing of the pulsations. In black the light curve with 5 s resolution is shown, in red with 40 s resolution. Superimposed in blue is the average pulse profile for the whole observation.
Current usage metrics show cumulative count of Article Views (full-text article views including HTML views, PDF and ePub downloads, according to the available data) and Abstracts Views on Vision4Press platform.
Data correspond to usage on the plateform after 2015. The current usage metrics is available 48-96 hours after online publication and is updated daily on week days.
Initial download of the metrics may take a while.