Free Access
Fig. 5
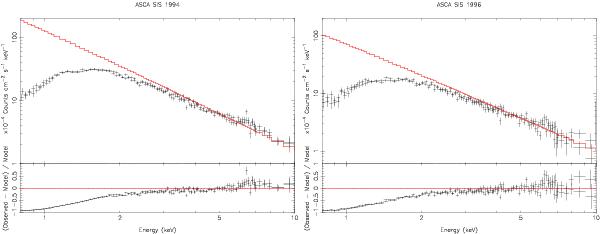
ASCA SIS spectra and residuals of NGC 7314 in the 1994 (left panel) and 1996 (right panel) observations. The solid line represents the power-law best-fit model to both SIS and GIS spectra excluding intrinsic absorption and the Fe Kα emission line. For clarity only the SIS0 and SIS1 spectra of each observation are plotted.
This figure is made of several images, please see below:
Current usage metrics show cumulative count of Article Views (full-text article views including HTML views, PDF and ePub downloads, according to the available data) and Abstracts Views on Vision4Press platform.
Data correspond to usage on the plateform after 2015. The current usage metrics is available 48-96 hours after online publication and is updated daily on week days.
Initial download of the metrics may take a while.