Fig. 7
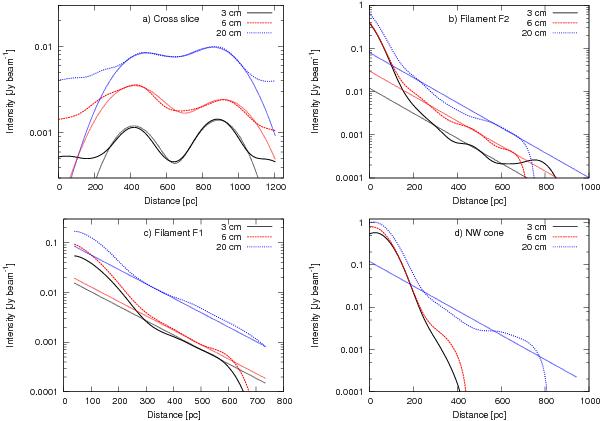
Slices of continuum emission where the dotted lines show the measured profiles and the solid lines the fit to the data. a) Slice across the filaments parallel to the central region at a distance of 300 pc. b) and c) Slices along the filaments F2 and F1, respectively. d) Slice along the NW outflow cone. For slices b)–d) a constant level of background emission estimated from a) was subtracted.
Current usage metrics show cumulative count of Article Views (full-text article views including HTML views, PDF and ePub downloads, according to the available data) and Abstracts Views on Vision4Press platform.
Data correspond to usage on the plateform after 2015. The current usage metrics is available 48-96 hours after online publication and is updated daily on week days.
Initial download of the metrics may take a while.