Free Access
Fig. 15
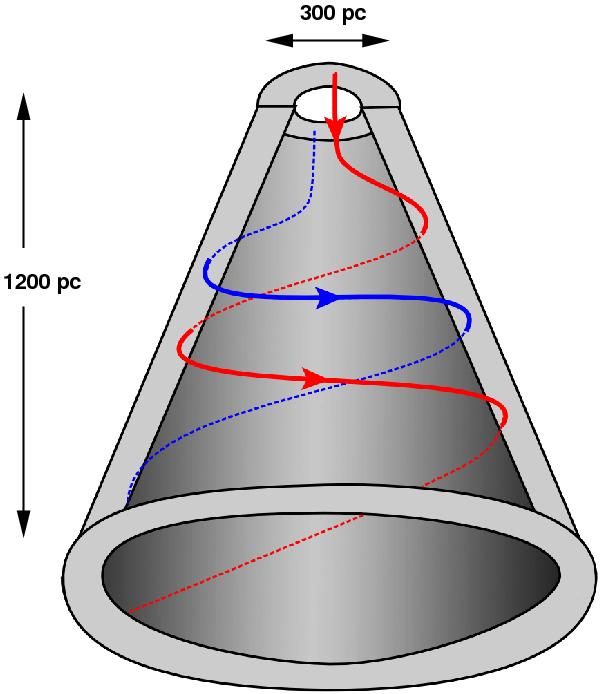
Sketch of the magnetic field in the walls bordering the SE outflow cone, which appears as filaments when seen in projection. Solid lines show field lines on the front side of the cone, whereas dotted lines show them on the rear side.
Current usage metrics show cumulative count of Article Views (full-text article views including HTML views, PDF and ePub downloads, according to the available data) and Abstracts Views on Vision4Press platform.
Data correspond to usage on the plateform after 2015. The current usage metrics is available 48-96 hours after online publication and is updated daily on week days.
Initial download of the metrics may take a while.