Fig. 5
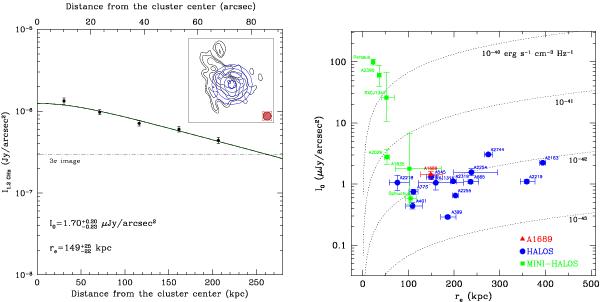
Left: the azimuthally averaged brightness profile of the radio halo emission in A1689 at 1.2 GHz. The profile has been calculated in concentric annuli centered on the cluster X-ray peak, as shown in the inset panel. The horizontal dashed-dotted line indicates the 3σ noise level of the radio image, while the continuous line indicates the best-fit profile described by an exponential law (see text). Right: best-fit central brightness I0 at 1.4 GHz versus the length scale re of A1689 in comparison with azimuthally averaged brightness profiles of radio halos and mini-halos taken from the literature (Murgia et al. 2009, 2010). The dotted lines indicate regions of constant synchrotron emissivity. The central brightness of A1689 has been rescaled at 1.4 GHz with α = 1 (see text).
Current usage metrics show cumulative count of Article Views (full-text article views including HTML views, PDF and ePub downloads, according to the available data) and Abstracts Views on Vision4Press platform.
Data correspond to usage on the plateform after 2015. The current usage metrics is available 48-96 hours after online publication and is updated daily on week days.
Initial download of the metrics may take a while.