Fig. 3
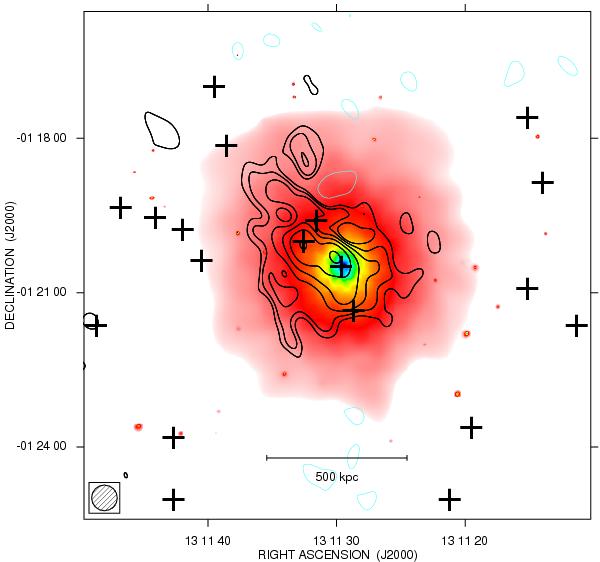
Total intensity radio contours at 1.2 GHz with the VLA in DnC configuration after subtraction of discrete sources. The image has an FWHM of 30 × 30. The contour levels are drawn at − 3 × 10⁻⁴ Jy/beam, 3 × 10⁻⁴ Jy/beam, and the rest are spaced by a factor  . The sensitivity (1σ) is 1 × 10⁻⁴ Jy/beam. Crosses indicate the positions of the subtracted discrete sources. The contours of the radio intensity are overlaid on the Chandra X-ray image shown in Fig. 1.
Current usage metrics show cumulative count of Article Views (full-text article views including HTML views, PDF and ePub downloads, according to the available data) and Abstracts Views on Vision4Press platform.
Data correspond to usage on the plateform after 2015. The current usage metrics is available 48-96 hours after online publication and is updated daily on week days.
Initial download of the metrics may take a while.