Free Access
Fig. 6
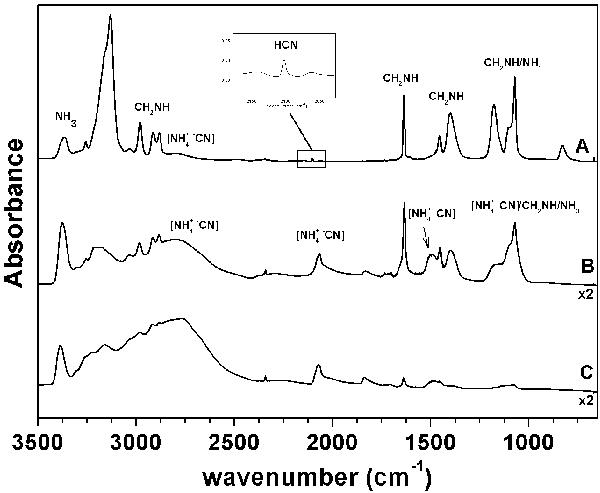
Infrared spectra of methanimine/HCN/NH3 deposit at 20 K in the presence
of either a methanimine excess (A), methanimine with a more important quantity of
[ −CN]
in comparison with spectrum A (B), or an excess of
[−CN]
(C).
−CN]
in comparison with spectrum A (B), or an excess of
[−CN]
(C).
Current usage metrics show cumulative count of Article Views (full-text article views including HTML views, PDF and ePub downloads, according to the available data) and Abstracts Views on Vision4Press platform.
Data correspond to usage on the plateform after 2015. The current usage metrics is available 48-96 hours after online publication and is updated daily on week days.
Initial download of the metrics may take a while.