Fig. 3
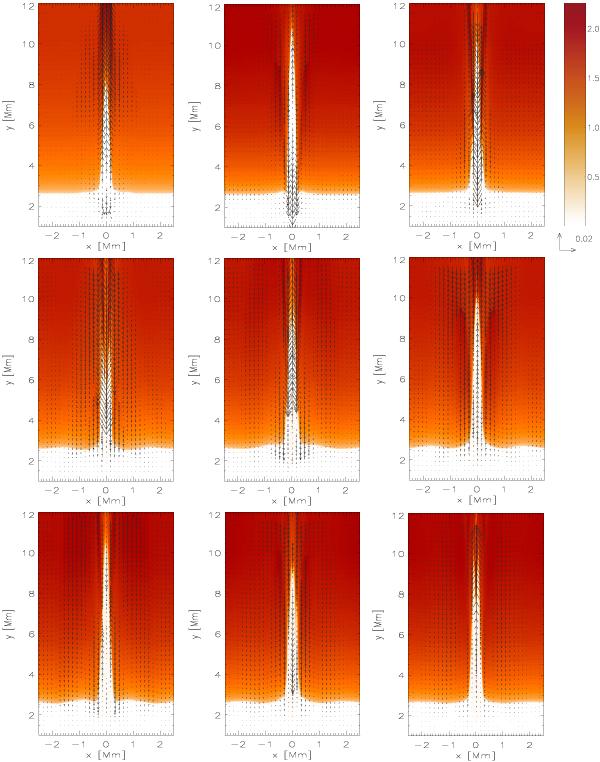
Temporal snapshots of simulated macrospicule in the case of essentially vertical magnetic field (see Sect. 3.1). The temperature (colour maps) and velocity (arrows) profiles at t = 100 s, t = 200 s, t = 300 s, t = 400 s, t = 500 s, t = 600 s, t = 700 s, t = 800 s, and t = 103 s (from top to bottom) for x0 = 0 Mm. Temperature is drawn in units of 1 MK. The arrow below each panel represents the length of the velocity vector, expressed in units of 30 km s-1. The colour bar is common to all the panels.
Current usage metrics show cumulative count of Article Views (full-text article views including HTML views, PDF and ePub downloads, according to the available data) and Abstracts Views on Vision4Press platform.
Data correspond to usage on the plateform after 2015. The current usage metrics is available 48-96 hours after online publication and is updated daily on week days.
Initial download of the metrics may take a while.