Fig. 9
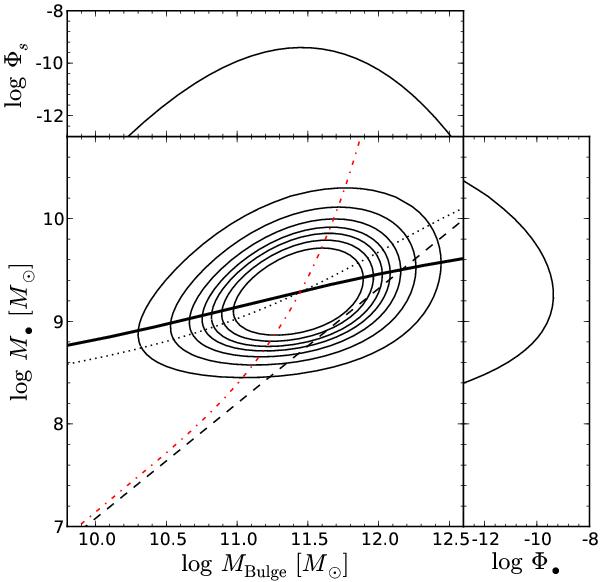
Same as Fig. 8, but with measurement uncertainty of 0.2 dex in the spheroid mass and no uncertainty in the black hole mass. The thick solid line shows the M•-MBulgerelation for the observed MBulge values, while the dotted line shows the same relation but for the true MBulge, i.e. for the case of no measurement uncertainty. The sample bias is not affected, but the slope of the M•-MBulgerelation flattens due to uncertainties in MBulge. The red dashed-dotted line shows again the mean relation ⟨ so ⟩ (μ), which is not affected by uncertainties in MBulge.
Current usage metrics show cumulative count of Article Views (full-text article views including HTML views, PDF and ePub downloads, according to the available data) and Abstracts Views on Vision4Press platform.
Data correspond to usage on the plateform after 2015. The current usage metrics is available 48-96 hours after online publication and is updated daily on week days.
Initial download of the metrics may take a while.