Fig. 8
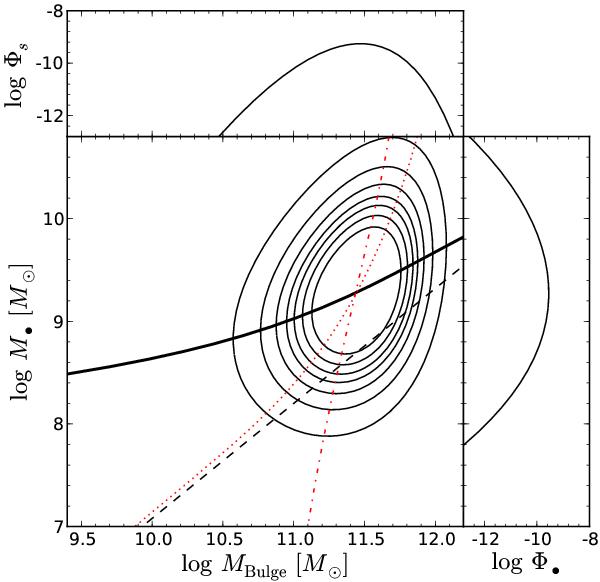
Predicted M•-MBulge diagram and its projections for a type 1 AGN sample, with luminosity limit of lmin = 47 (as the right panel of Fig. 3). For the black hole masses an uncertainty of 0.3 dex is assumed, representing the intrinsic uncertainty in the virial method. A thick solid line shows the observed M•-MBulgerelation for the observed M•, which is identical to the relation without uncertainty in the virial mass. Only the scatter in the relation is increased. The red dashed dotted line shows the mean relation ⟨ s ⟩ (μo), while the dotted red line gives the mean relation ⟨ s ⟩ (μ), i.e. without measurement uncertainty in the black hole mass.
Current usage metrics show cumulative count of Article Views (full-text article views including HTML views, PDF and ePub downloads, according to the available data) and Abstracts Views on Vision4Press platform.
Data correspond to usage on the plateform after 2015. The current usage metrics is available 48-96 hours after online publication and is updated daily on week days.
Initial download of the metrics may take a while.