Fig. 6
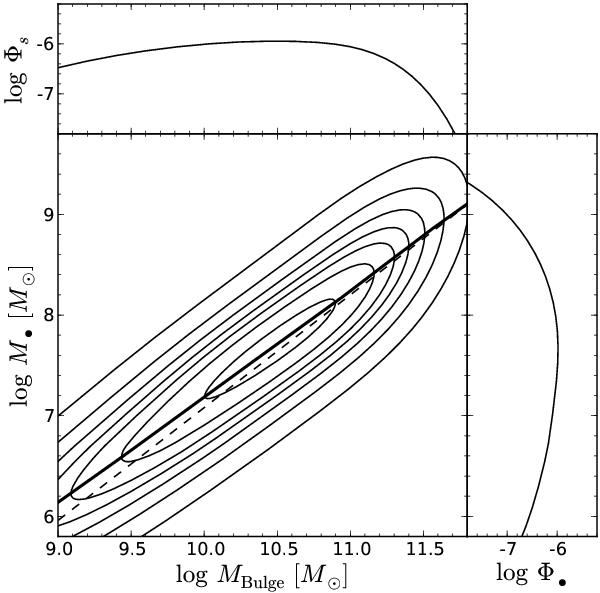
Predicted M•-MBulge diagram and its projections for a local type 1 AGN sample, simulating the reverberation mapping sample. A flux limit in the redshift interval (0.003,0.15) and a luminosity limit are applied to the sample, based on the observed range for the reverberation mapping AGN. For this sample a mild bias of 0.09 dex is estimated.
Current usage metrics show cumulative count of Article Views (full-text article views including HTML views, PDF and ePub downloads, according to the available data) and Abstracts Views on Vision4Press platform.
Data correspond to usage on the plateform after 2015. The current usage metrics is available 48-96 hours after online publication and is updated daily on week days.
Initial download of the metrics may take a while.