Fig. 5
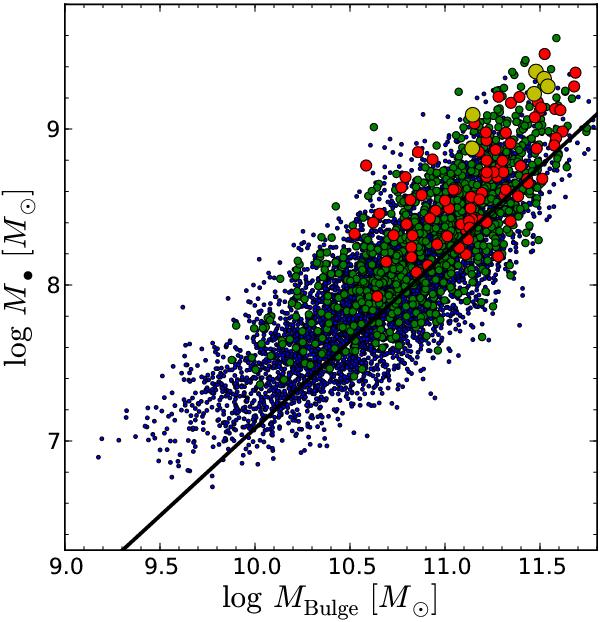
M•-MBulge diagram for a Monte Carlo simulation of a local AGN sample. The differently sized and coloured symbols correspond to different luminosity limits applied to the sample. Blue, green, red, and yellow symbols show the sample when culled at a bolometric luminosity of lmin = 45, 45.5, 46, and 46.5 in logarithmic units. The solid black line shows the input relation for the sample from Häring & Rix (2004).
Current usage metrics show cumulative count of Article Views (full-text article views including HTML views, PDF and ePub downloads, according to the available data) and Abstracts Views on Vision4Press platform.
Data correspond to usage on the plateform after 2015. The current usage metrics is available 48-96 hours after online publication and is updated daily on week days.
Initial download of the metrics may take a while.