Fig. 4
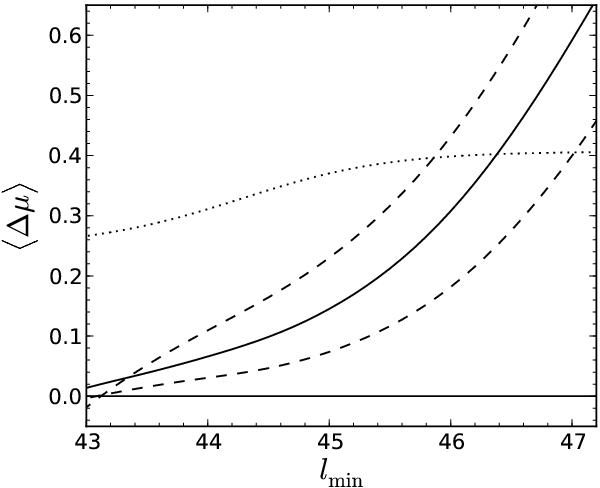
Predicted overall bias for a luminosity limited local (z ≈ 0) type 1 AGN sample as a function of the low luminosity limit (in logarithmic units). The solid line shows our prediction for σ = 0.3, while the dashed lines show the predictions for σ = 0.4 (upper line) and σ = 0.2 (lower line). The dotted line shows the prediction from Lauer et al. (2007), but for our local AGN luminosity function; see text for an explanation of the differences.
Current usage metrics show cumulative count of Article Views (full-text article views including HTML views, PDF and ePub downloads, according to the available data) and Abstracts Views on Vision4Press platform.
Data correspond to usage on the plateform after 2015. The current usage metrics is available 48-96 hours after online publication and is updated daily on week days.
Initial download of the metrics may take a while.