Fig. A.1
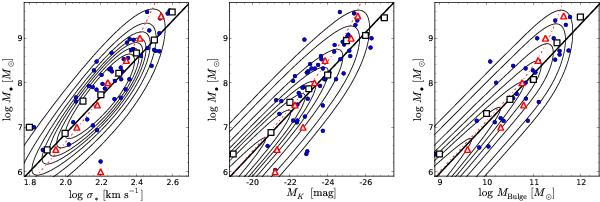
Comparison of our bivariate probability distribution Ψ(s,μ) (contours) with observational data of black holes with dynamical mass measurements (blue circles). The thick black line shows the mean relation ⟨ μ ⟩ (s), the red dashed dotted line shows ⟨ s ⟩ (μ). The black open squares gives the mean μ binned in s from the observations (an estimate of ⟨ μ ⟩ (s)) and the red open triangles gives s binned in μ (an estimate of ⟨ s ⟩ (μ)). Left panel: M• − σ ∗ sample from Gültekin et al. (2009). Middle panel: M• − MK sample from Hu (2009). Right panel: M• − Mbulge sample from Häring & Rix (2004).
Current usage metrics show cumulative count of Article Views (full-text article views including HTML views, PDF and ePub downloads, according to the available data) and Abstracts Views on Vision4Press platform.
Data correspond to usage on the plateform after 2015. The current usage metrics is available 48-96 hours after online publication and is updated daily on week days.
Initial download of the metrics may take a while.