Fig. 2
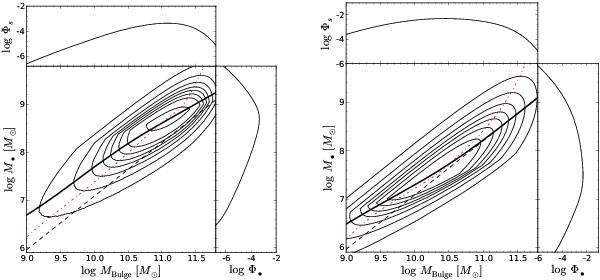
The bivariate probability distribution function and its projections for a sample of black holes with dynamically measured masses, under the presence of a sample selection depending on the resolution of the black hole’s sphere of influence. A threshold of Rinf/dres > 1 (left panel) or Rinf/dres > 0.1 (right panel) is applied to the sample. The dashed black line shows the input M•-MBulgerelation, the thick black solid line highlights the “observed” relation ⟨ μ ⟩ (s), and the red dashed dotted line indicates the “observed” relation ⟨ s ⟩ (μ).
Current usage metrics show cumulative count of Article Views (full-text article views including HTML views, PDF and ePub downloads, according to the available data) and Abstracts Views on Vision4Press platform.
Data correspond to usage on the plateform after 2015. The current usage metrics is available 48-96 hours after online publication and is updated daily on week days.
Initial download of the metrics may take a while.